


How Drought Hit Trend Yields
Posted: February 27, 2013
Most of us know where the drought hit the hardest last year, but it’s always more interesting to see it in living color.
The University of Illinois’ FarmDoc Daily did just that by comparing state corn yields last year with trend yields, showing how much yields were reduced in the most drought-stricken areas. You can click on the map below to see a larger version.
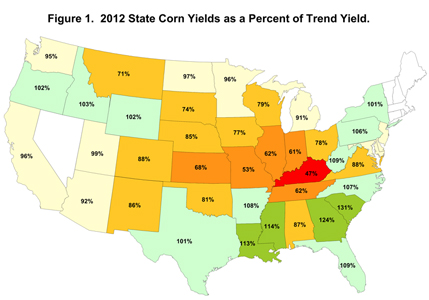
The map highlights how the lowest yields were in Kentucky (47 percent of trend) and Missouri (53 percent) and Indiana and Illinois came in at about 62 percent of trend. Much of the rest of Corn Belt saw yields around 75 percent of the trend line. Minnesota and North Dakota had yields close to trend, while most states in the Southeast had above trend yields. Georgia was 24% above trend and South Carolina was 31%, which would be great if those states were not generally ranked in the bottom half of corn growing states. New York and Maryland grow more corn than Georgia and South Carolina.
University of Illinois ag economist Gary Schnitkey, who did the map, says as bad as it was, the drought could have been worse.
“In some senses, though, the US dodged a bullet with the 2012 drought,” said Schnitkey. “Much lower total supplies would have resulted had the center of the drought occurred in eastern Iowa and northern Illinois. A center here would have impacted all of the corn-belt in a much worse way, potentially causing the western corn-belt to have as low of yields as the eastern corn-belt. As it actually occurred, Iowa and other western corn-belt state were not as badly hit as could have been the case.”